Linear Regression
- Terms and Definitions:
- What is Linear Regression?
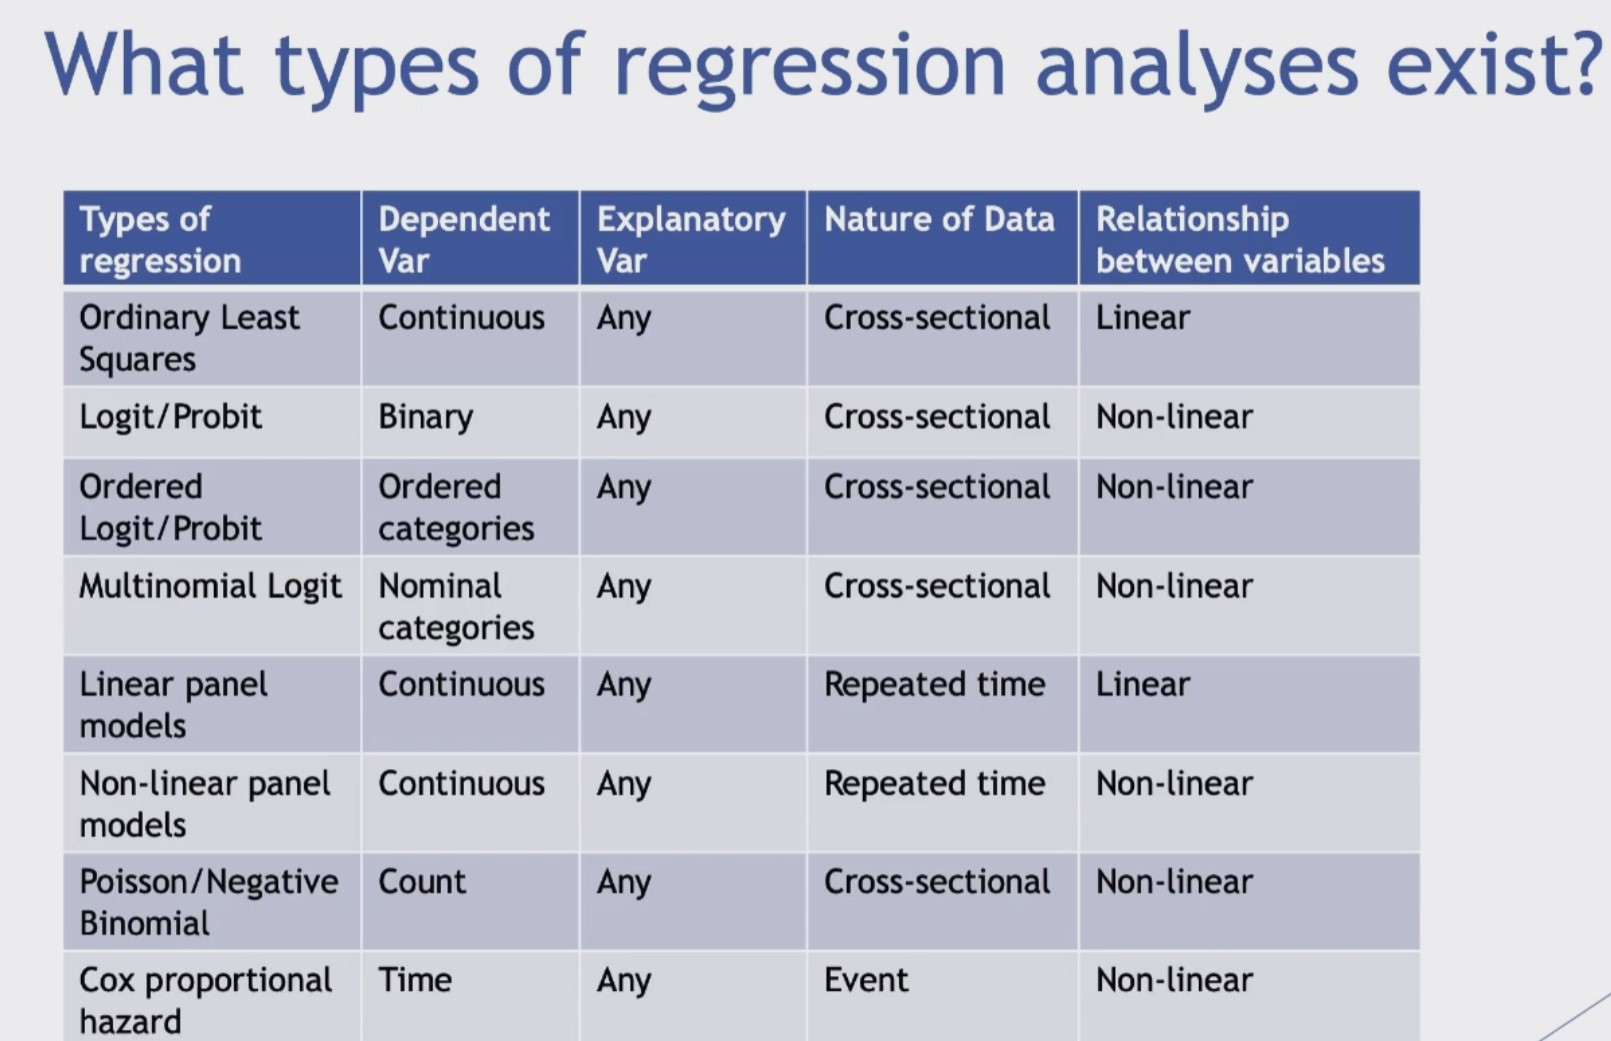
- Types of Linear Regression
- Assumptions of Linear Regression?
- Bias and Variance in linear regression?
- Ordinary Least Squares:
- Derivation
- Coefficient of Determination or \(R^2\)
- Interpreting Coefficient Report:
- Compare Linear Regression with Decision Trees:
- References:
Terms and Definitions:
| Term | Definition |
|---|---|
| OLS | Ordinary Least Square |
| Bias | The expected value of the estimator is not equal to the population parameter |
| Estimator | |
| Regressor | |
| Homescadacity | |
| Confidence Interval | |
| Prediction Interval | |
| Residue | |
| Error | |
| IID | Independent and identically distributed |
| Serial or auto correlation | |
| Pearson Correlation | |
| Endogeneity | |
| Omitted Variable Bias | |
| Confounding Variables |
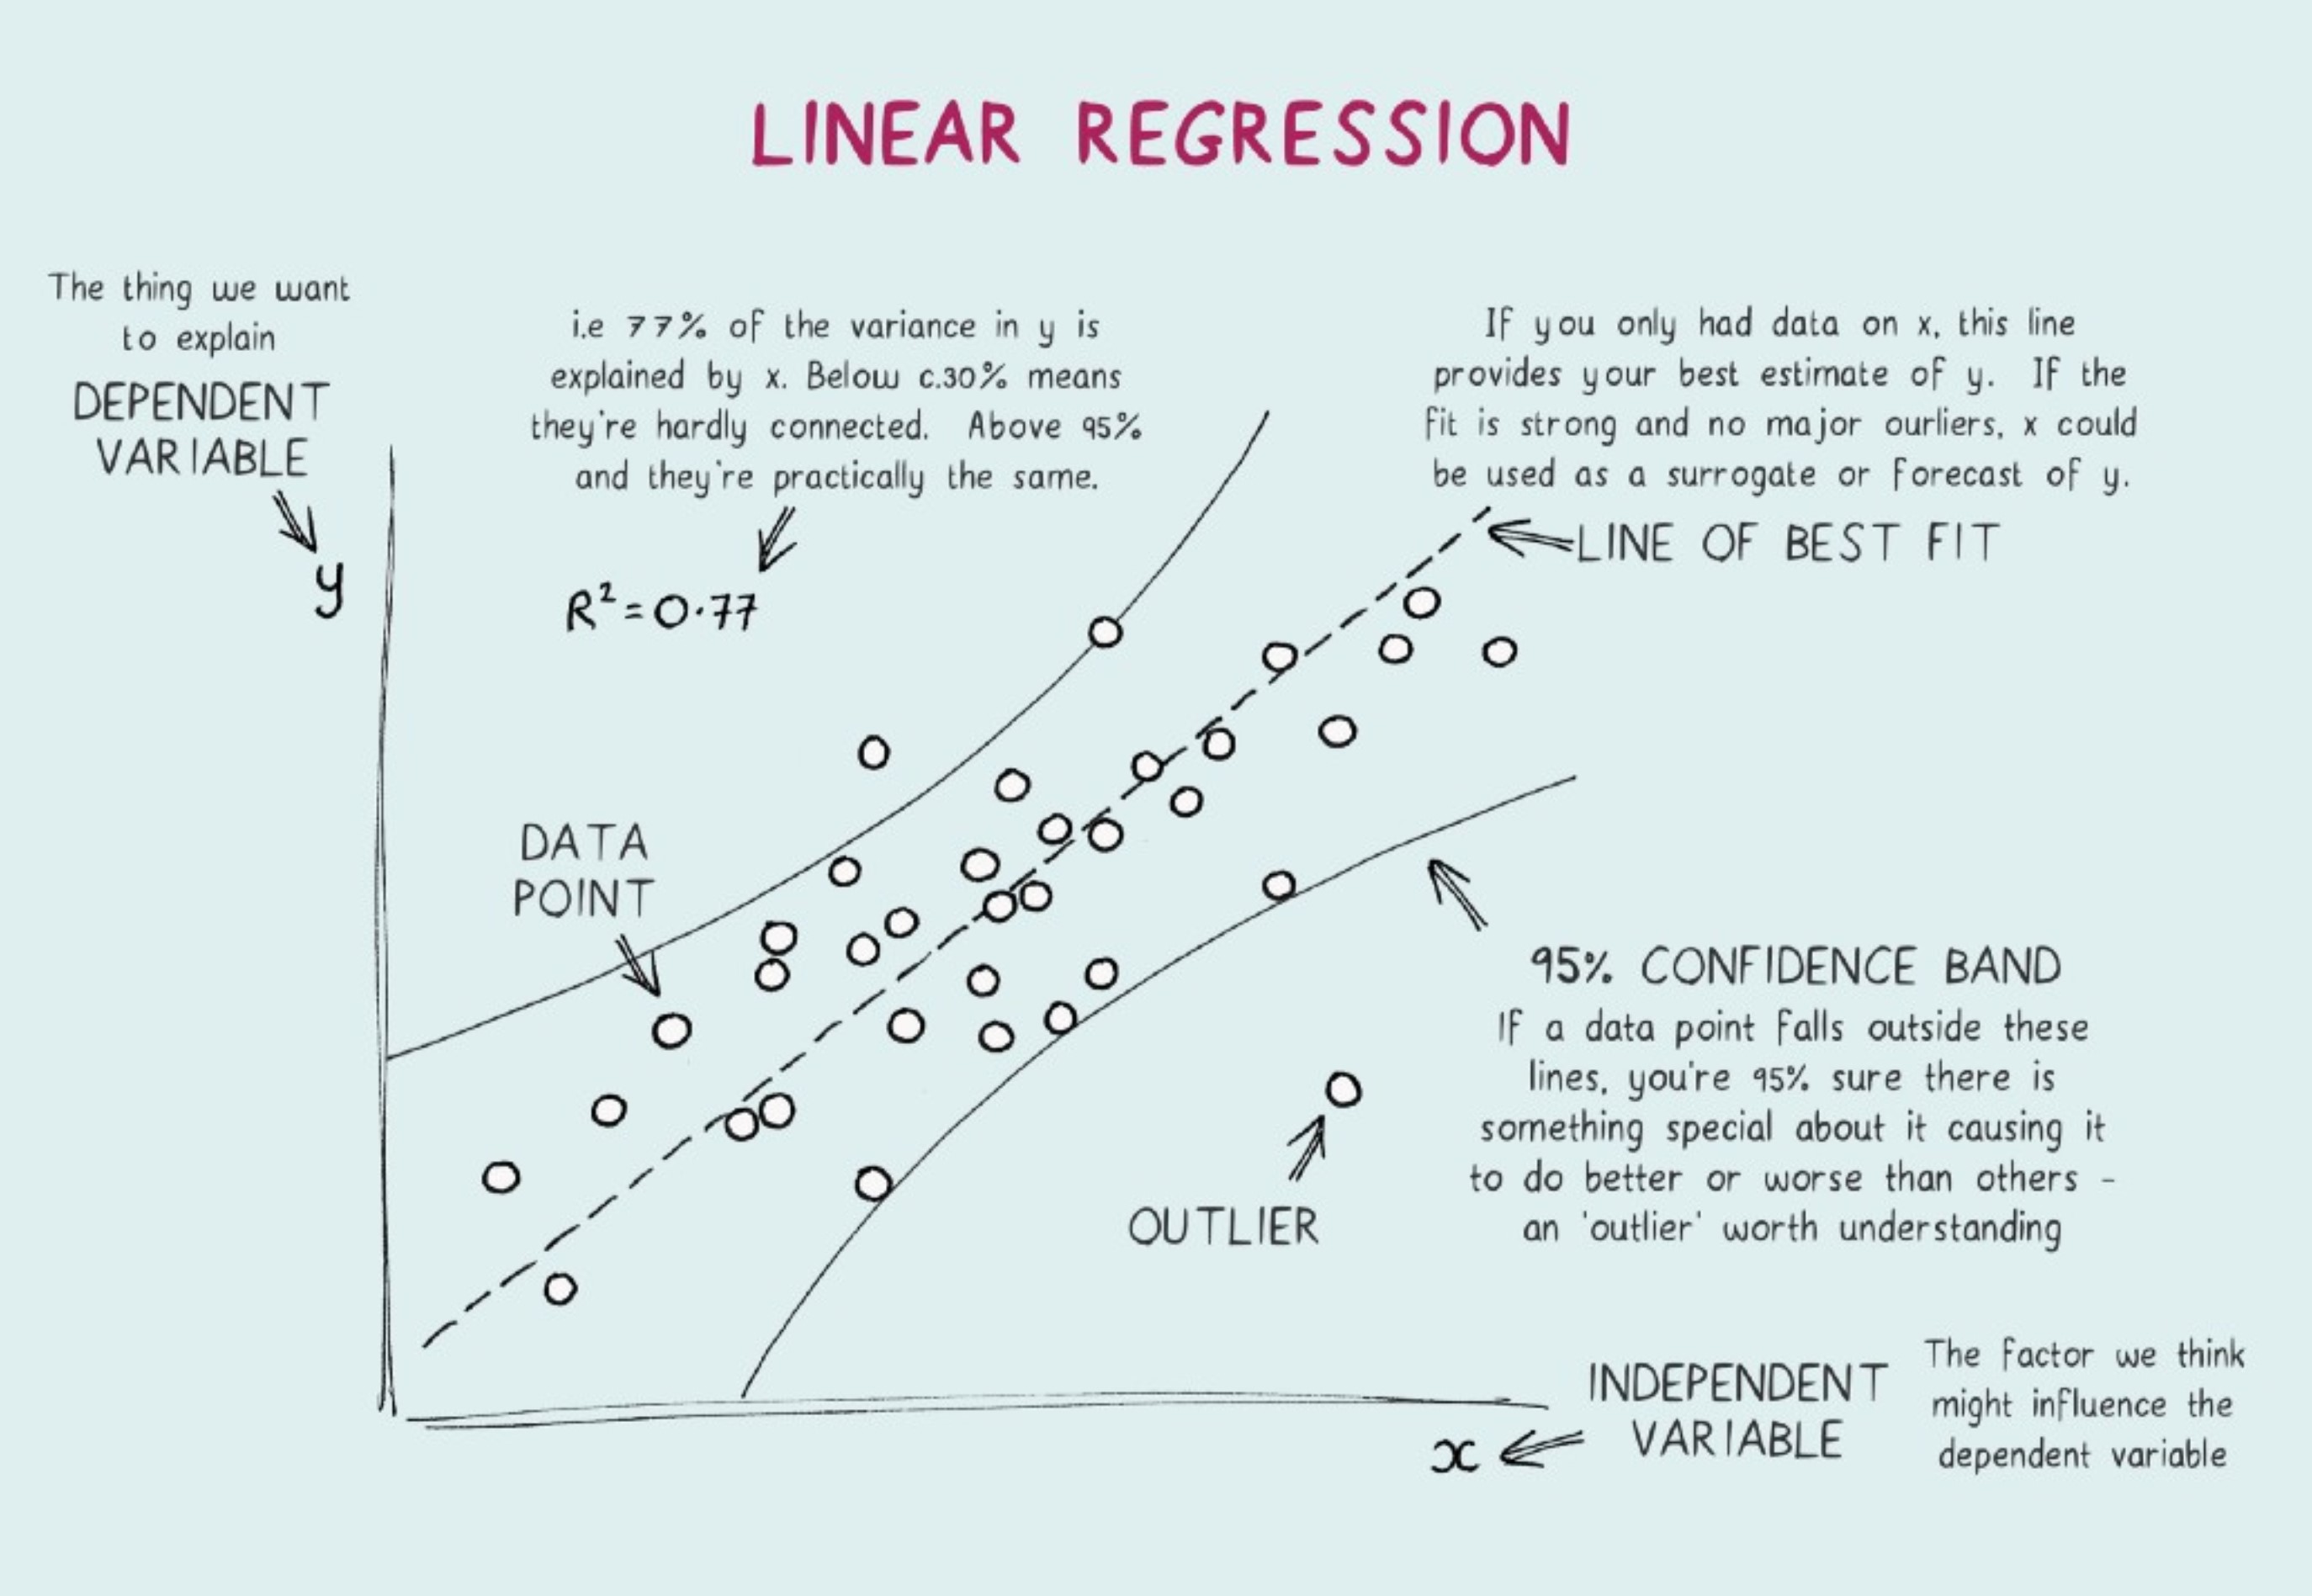
What is Linear Regression?
-
Linear Regression analyzes the relationship between the dependent variable (Y) and one, or more independent variables (explanatory) X1, X2, X3….Xn
-
This allows for the statistical testing of hypothesis
-
The slope β1 is the change in the mean of the distribution of y produced by a unit change in x.
-
If the range of data on x includes x = 0, then the intercept β0 is the mean of the distribution of the response y when x = 0. If the range of x does not include zero, then β0 has no practical interpretation.
Types of Linear Regression
Assumptions of Linear Regression?
-
Linearity: The model is linear in the coefficients and the error term. One way to confirm this is using scatter plot.
-
Normality The error term has a population mean of zero and normally distributed. One way to verify this is using Q-Q Plots. JB test or Jarque-Bera test is another approach to test normality.
-
No Multicollinearity: This explains the correlation between the predictor variables. No independent variable is a perfect linear function of other explanatory variable. Some approaches to verify this are pairplots, heat maps, and variance inflation factor (VIF).
-
Homoscedasticity The error term has constant variance or the variability of the dependent variable being equal across the independent variable values. One way to validate thi sis using Breusch-Pagan Test. Scatterplot is another approach.
-
No auto correlation in residuals: This means model residuals are not independent. Durbin-Watson test is one way to validate this assumption.
Bias and Variance in linear regression?
- Bias is computed as the distance from the average prediction and true value — true value minus mean(predictions)
- Bias means that the expected value of the estimator is not equal to the population parameter.
- Variance is the average deviation from the average prediction — mean(prediction minus mean(predictions))
Ordinary Least Squares:
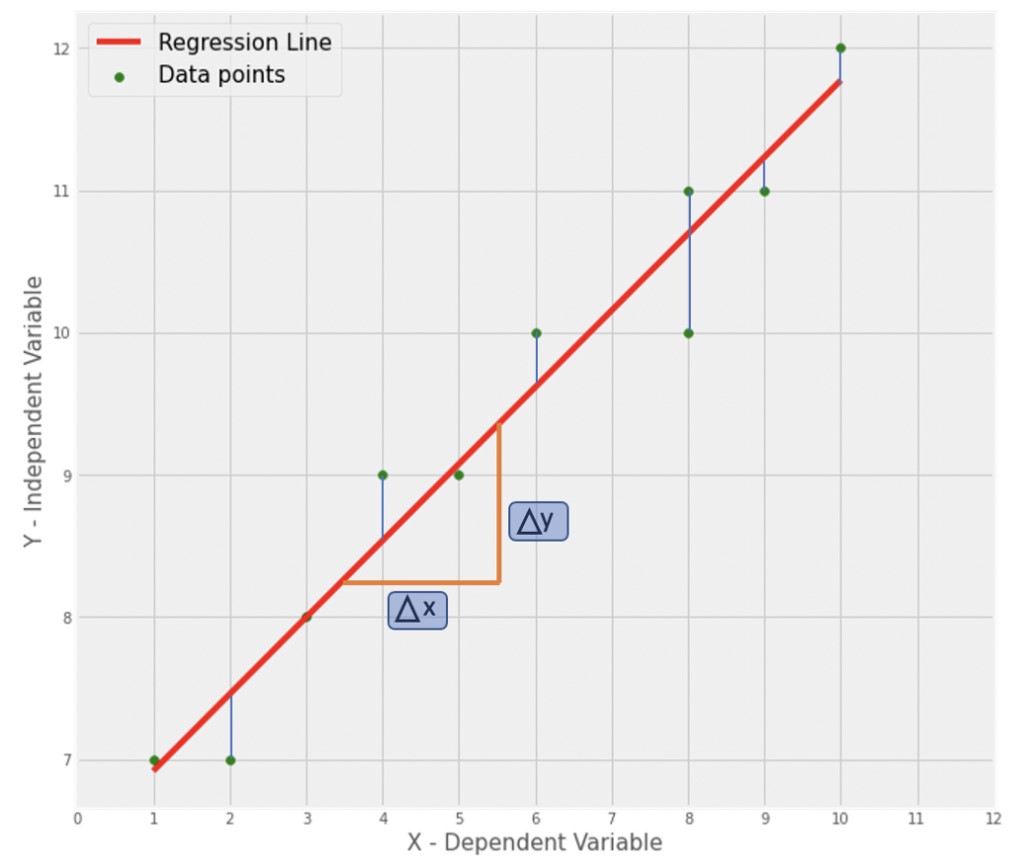
- When we are attempting to find the “best fit line”, the regression model can sometimes be referred to as Ordinary Least Squares Regression. This just means that we’re using the smallest sum of squared errors. The error is the difference between the predicted y value subtracted from the actual y value. The difference is squared so there is an absolute difference, and summed.
Derivation
Formula for Straight line: \[ Y = mx + c \]
Formula for estimated straight line: \[ \hat Y = \hat mx + \hat c \]
Rewriting it as slope and Intercept: \[ \hat Y = \beta 0 + \beta1x \]
Formula to calculate slope and intercept: \[\begin{eqnarray} \text{slope} = \frac{\Delta Y}{\Delta X} \nonumber \\\ \Delta Y = ((np.mean(X) \times np.mean(Y)) - np.mean(X \times Y)) \nonumber \\\ \Delta X = ((np.mean(X)^2) - np.mean(X \times Y)) \nonumber \\\ \boxed{m = Δ𝑦 / Δ𝑥} \end{eqnarray}\]
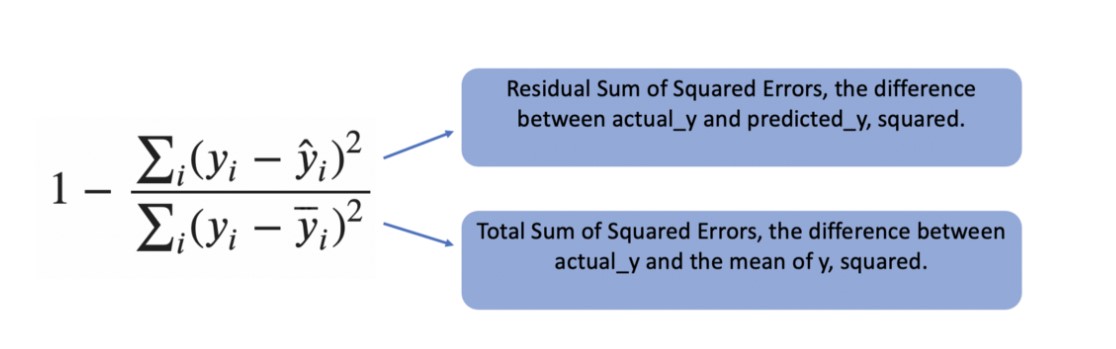
Coefficient of Determination or \(R^2\)
- The R-Squared measure can be used to determine a how well a model fits the data. This measure is also known as the Coefficient of Determination. R-Squared takes a simple model which uses the mean of the actual_y values to predict new_y values. The model will always predict this mean as the new_y regardless of the x value. This simple model is compared to a fit regression model to determine how well its fit.
Interpreting Coefficient Report:
-
R-Squared: - This explains the variance percentage by the model
-
Adjusted R-Squared: R-squared where additional independent variables are penalized.
-
F-Statistic: Explains the significance of fit.
-
P Value: P-value for each term tests the null hypothesis that the coefficient is equal to zero or has no effect. A low p value indicate that we can reject the null hypothesis. This means, changes in the independent variable are related to changes in teh response variable. Larger P value means the opposite.
-
Regression Coefficient: This represent the mean change in teh response variable for one unit change in the predictor variable while holding other predictors constant. Think them as slopes and they are called slope coefficients.
Compare Linear Regression with Decision Trees:
- DT supports non linearity.
- When the dataset has large number of features and less observations, LR may outperform DT.
- DT works better for categorical variables and handles colinearity better than LR.
- LR is parametric while DT is non parametric.